
Streaming music leaves rights owners – particularly the publisher, society, composer, author groups – with two major challenges. First, the Digital Service Providers (DSP’s) like Apple, Spotify, Amazon, Tidal, Deezer, Pandora, etc, can send anywhere from 1.5 to 5 million different tracks in a monthly usage report. The massive volume of tracks used and reported every month has quickly become overwhelming. Second, The descriptive metadata is flawed at best and missing at worst. The information we got from the “liner notes” in vinyl and CD’s are seldom available online. The names of composer/authors are often missing or wrong, even on major releases.
This is why it is so important for digital rights administrators to be able to both handle vast amounts of data (without “cutting off the long tail”) and triangulate the flawed/ambiguous metadata accurately in order to match all tracks to their corresponding works. Indeed, the ability of a digital rights administrator to master both aspects are key if the rights owners are not to end up losing more when paying less for services.
Below, I will look at the challenges of handling the massive amounts of usage data reported by DSPs and how that affects rights owners collections. In a later post I will focus on the prevalence of flawed metadata and the effect it has on payouts.
CUTTING VOLUMES MEANs LOSING Money
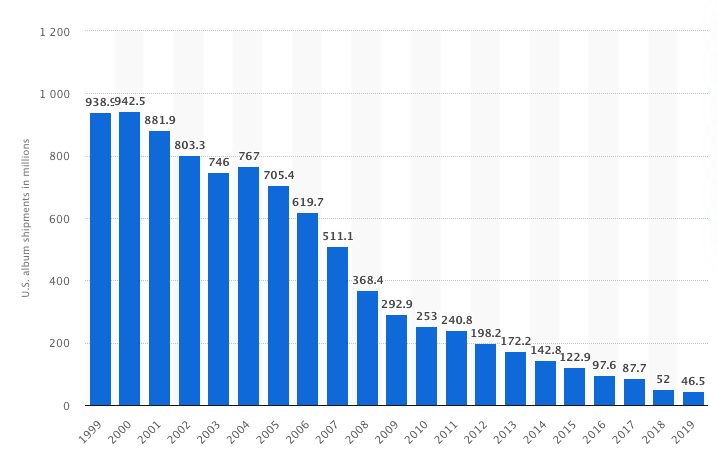
In the year 2000, at the peak of CD sales, 942,500,000 CD’s were shipped in the United States. As an example, let’s assume that each release sold 1,000 copies on average. If each release had 10 tracks we would be dealing with 9,425,000 unique tracks in the year 2000 alone.
As high as that number may seem, it is only what roughly represents one or two monthly usage reports from one DSP for one product tier! In short, what was once years if not decades of usage data is now reported every month in the digital music industry! Indeed, I have previously calculated that the online music data volume in the Nordic region rose from index 100 in the year 2000 to index 112,500 in 2013 – and that was seven years ago!
So how did the industry cope with this increase?
Well, when 90-95% of value can be found in the first 20-40% of used tracks (cf. above between 300K and 1,600K tracks), it was, and is, “easy” to simply not analyse the remaining 1,200K – 2,400K tracks for the last 5-10% of value. Particularly since it simply became too expensive and/or time consuming for the rights owners/administrators to analyse the data in the tail. Hence it became an industry standard solution to “Cut off the Long Tail” when processing data, and focus only on the lucrative part in the “hits” section.
While this solution saved you 60-80% of the workload, this also meant that rights owners said goodbye to 5-10% of revenues in an otherwise equal scenario! Even then, we know that not all the remaining 20-40% of data was or is always processed.
Leave No Bit Behind – MPAC to the rescue
When we set out on Muserk’s voyage to become a leading global digital rights administrator, we set the goal that our back end had to be able to cope with all the data volumes.We were going to leave no stone unturned – leave no bit behind. Not only do we believe that everyone should get paid correctly, we also believe that our customers and their rights owners have the right to know when their work was matched but did not generate (enough) money to warrant a distribution. As our Head of Technology, Collin White, put it; “we have to carry the zeroes as well as the heroes”.
So that is what we did. Today, our proprietary scaled cloud infrastructure, MPAC ( Muserk Primary Automation Cortex), enables us to handle a multitude of workflows simultaneously. This enables Muserk to process tens of millions of reporting lines in less than an hour. To draw on our example of CD’s in the year 2000, Muserk processes a year’s worth of data in less than an hour or more. That’s two decades of data in less than a day! At Muserk, we are able to look at every single reporting line, every single track, every single bit and match it to our customers repertoire. And, from first-hand experience, we can see the difference that makes to our customers and their earnings.
Money Spent Is Actually Money Earned!
“So how does this affect my collections?”, you may ask. Well, in an industry where the average commission rate is typically between 10% and 20%, finding the 5-10% of value in the long tail makes a huge difference when calculating the actual value of a service. In fact, you can very easily end up with less money by paying a lower service fee.
For example, rights administrator A charges 11% commission, but cuts off the tail and only finds 90% of value. This leaves you with about 80% of your copyright value, and with no visibility of the long tail. Thus, you have no idea which works represent 10% of the value of your rights, how they are used, by whom they are used, and where your usage is coming from. Conversely, rights administrator B charges 19%, but does not cut off the long tail. Now you are getting 81% of your copyright value plus full granularity on all usage! In short, the true value of a digital rights administrator is more than its price tag. That is true when you look at volumes alone, but even more so when you include accuracy.

More to come
In my next blog post I will look at how the ability to accurately triangulate the flawed metadata of the online industry further augments the example on price and value above. Stay tuned for more! In the meantime, feel free to check out some of the other Muserk blog posts.